Sitemap
A list of all the posts and pages found on the site. For you robots out there is an XML version available for digesting as well.
Pages
Posts
Distinguishing Activation from Inhibition with Relation-Aware Graph Neural Networks
In my last post, I discussed self-supervised edge prediction as a way of embedding genes using a gene-regulatory network.
This approach allows genes, metabolites, drugs and other vertices to be connected based on shared network topology. However, to date I’ve only discussed edge prediction using a dot-product head, where a vertex-pair’s edge support is a direct readout of their similarity in embedding space (𝐚 · 𝐛). While surprisingly powerful, this head has limitations when vertices are heterogeneous or interact in qualitatively different ways — particularly when we want to distinguish between activation and inhibition.
Here, I explore more expressive approaches for learning mappings between A → B by evaluating both general edge prediction heads (like MLPs) and “relation-aware” heads that can learn distinct mappings for different edge types. The post will cover:
- Data model and training changes enabling relation-specific predictions
- Geometric analysis revealing how relation-aware heads encode regulatory semantics
- PerturbSeq validation demonstrating successful prediction of signed regulatory interactions
- Pre-trained models available on HuggingFace

Napistu meets PyTorch Geometric - Predicting Regulatory Interactions with Graph Neural Networks
Biological applications of graph neural networks (GNNs) typically work with either small curated networks (100s-1,000s of nodes) or aggressively filtered subsets of large databases like STRING. The Octopus graph — which I introduced in my previous post — occupies a different space entirely. By integrating eight complementary pathway databases, it creates a genome-scale network with ~50K proteins, metabolites, and complexes spanning ~10M edges, all while preserving rich metadata about edge provenance, confidence scores, and mechanistic detail that filtered approaches discard.
This puts the Octopus in uncharted territory: large enough to capture genome-scale complexity, yet structured enough to preserve the biological interpretability that makes network analysis valuable. GNNs scale well beyond genome-scale requirements (100M+ nodes in social networks), but remain unexplored for comprehensive biological networks that integrate regulatory, metabolic, and interaction data. Bridging this gap requires infrastructure that handles both the biological complexity of multi-source networks and the engineering complexity of training GNNs at scale.
In this post, I’ll introduce Napistu-Torch — the infrastructure that finally makes this space navigable. Available from PyPI and indexed by the Napistu MCP server, Napistu-Torch provides a modular, reproducible framework for training GNNs on comprehensive biological networks. I’ll demonstrate that it’s feasible to train graph convolutional networks on the complete Octopus network using just a laptop (albeit with 2 days of training time for the full suite of models). But the real contribution is the ecosystem: the data structures, pipelines, and evaluation strategies that unlock far more sophisticated analyses.

Napistu’s Octopus: An 8-source human consensus pathway model
Introducing the Octopus: Napistu’s eight-source Human Consensus Pathway Model that unites the breadth of protein-protein interaction networks with the depth of regulatory databases and metabolic models.The result is a genome-scale directed graph that is both densely connected and mechanistically precise. In this post, I will:
- Provide an overview of the Octopus model and its construction
- Show side-by-side summaries of individual data sources highlighting their complementarity
- Demonstrate that the model successfully merges results, creating a dense network covering the complete cellular repertoire of genes, metabolites, drugs, and complexes
- Illustrate how source-level information can be carried forward to the Octopus’s graphical network to augment its vertex and edge features

Building AI-Friendly Scientific Software: A Model Context Protocol Journey
In this post, I walk through building a remote Model Context Protocol (MCP) server that enhances AI agents’ ability to navigate and contribute meaningfully to the complex Napistu scientific codebase.
This tool empowers new users, advanced contributors, and AI agents alike to quickly access relevant project knowledge.
Before MCP, I fed Claude a mix of README files, wikis, and raw code hoping for useful answers. Tools like Cursor struggled with the tangled structure, sparking the idea for the Napistu MCP server.
I’ll cover:
- Why I built the Napistu MCP server and the problems it solves
- How I deployed it using GitHub Actions and Google Cloud Run
- Case studies showing how AI agents perform with — and without — MCP context
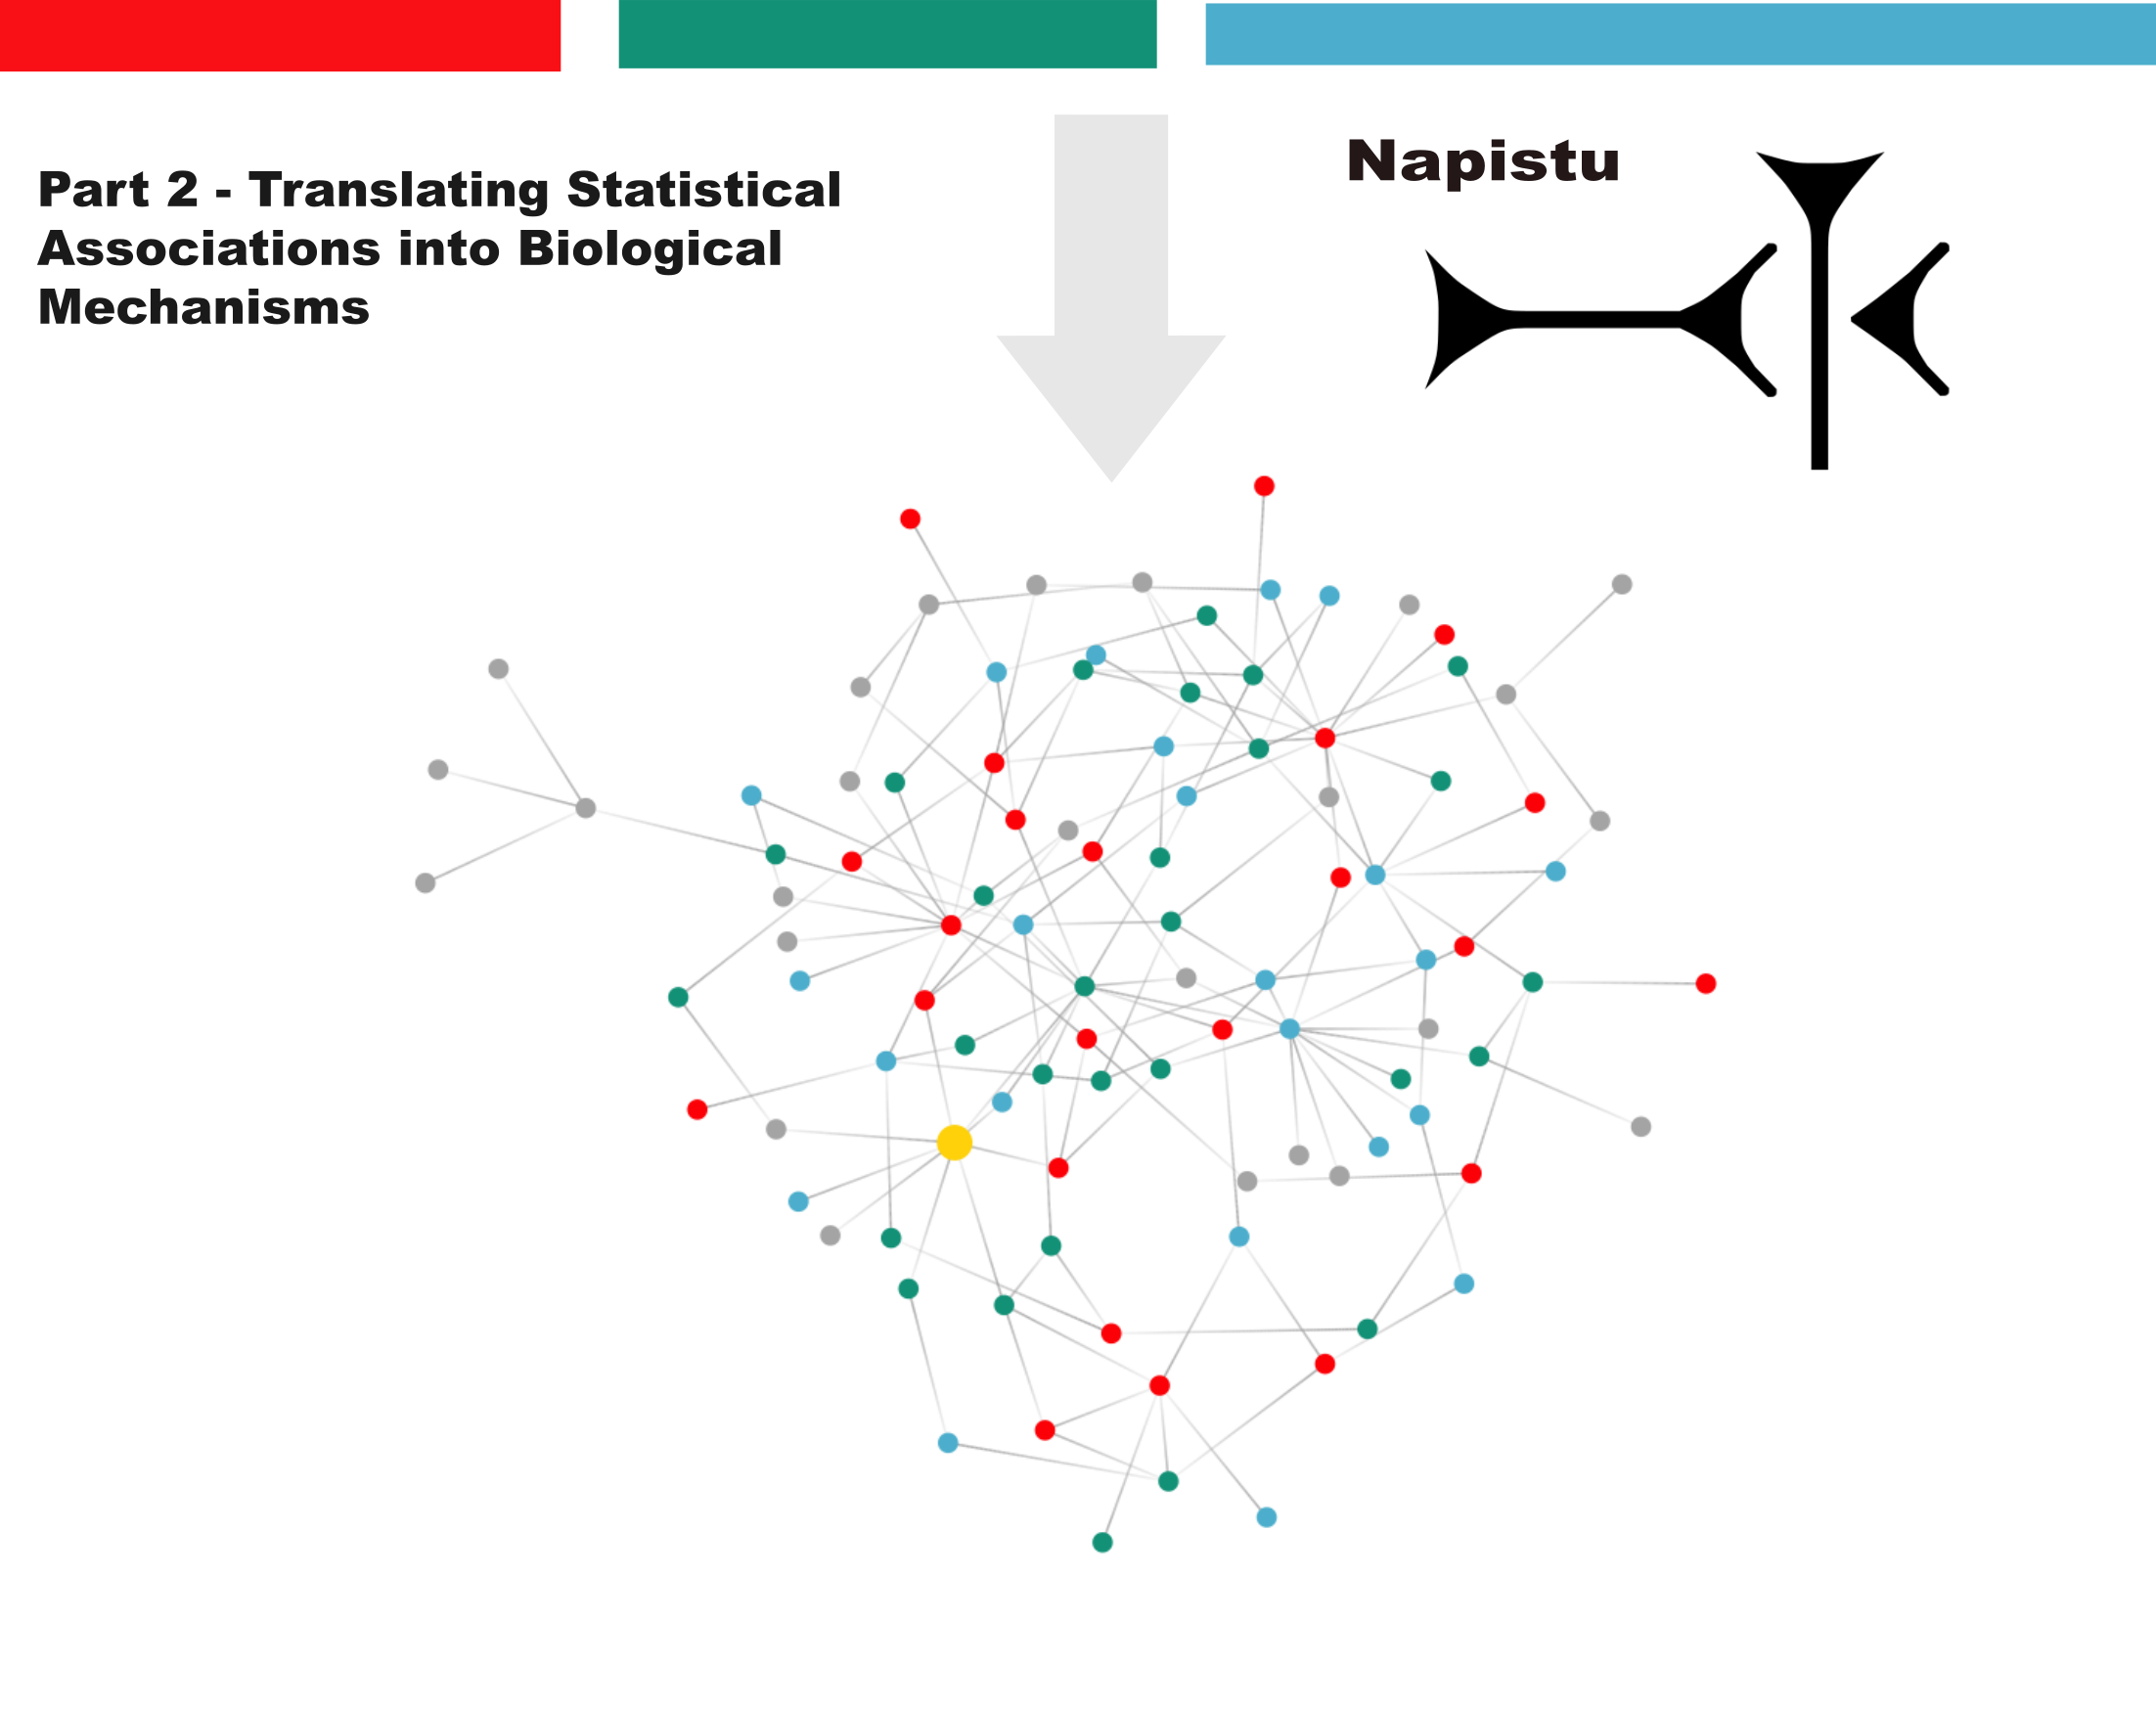
Network Biology with Napistu, Part 2: Translating Statistical Associations into Biological Mechanisms
This is part two of a two-part series on Napistu — a new framework for building genome-scale molecular networks and integrating them with high-dimensional data. Using a methylmalonic acidemia (MMA) multimodal dataset as a case study, I’ll demonstrate how to distill disease-relevant signals into mechanistic insights through network-based analysis.
From statistical associations to biological mechanisms
Modern genomics excels at identifying disease-associated genes and proteins through statistical analysis. Methods like Gene Set Enrichment Analysis (GSEA) group these genes into functional categories, offering useful biological context. However, we aim to go beyond simply identifying which genes and gene sets change. Our goal is to understand why these genes change together, uncovering the mechanistic depth typically seen in Figure 1 of a Cell paper. To achieve this, we must identify key molecular components, summarize their interactions, and characterize the dynamic cascades that drive emergent biological behavior.
In this post, I’ll demonstrate how to gain this insight by mapping statistical disease signatures onto genome-scale biological networks. Then, using personalized PageRank, I’ll trace signals from dysregulated genes back to their shared regulatory origins. This transforms lists of differentially expressed genes into interconnected modules that reveal upstream mechanisms driving coordinated molecular changes.
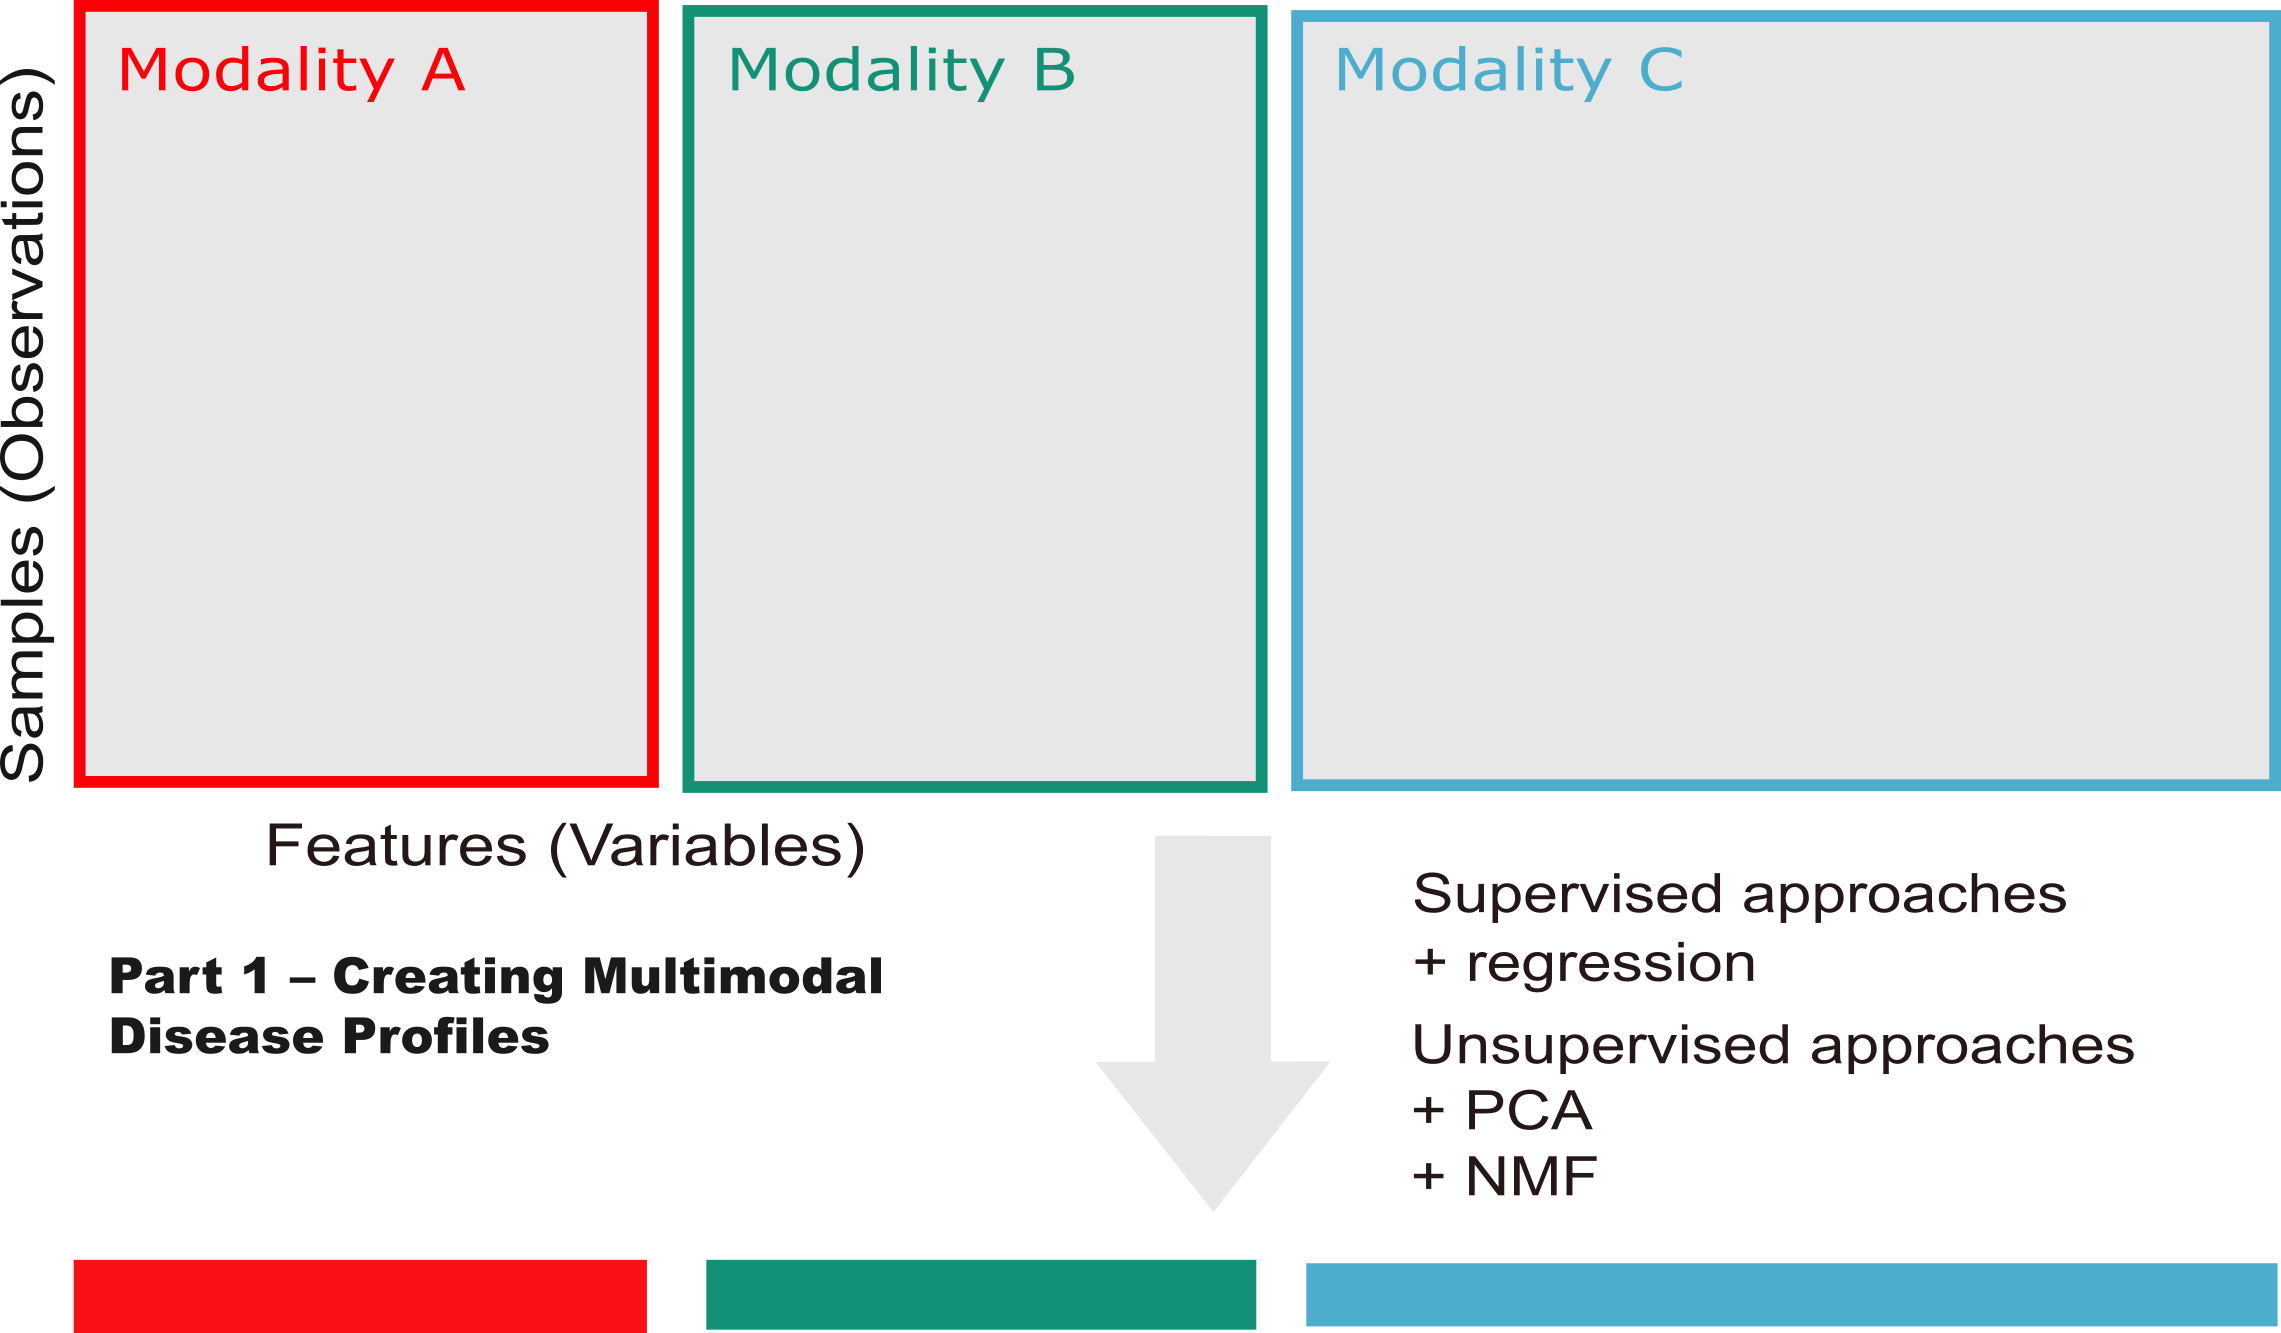
Network Biology with Napistu, Part 1: Creating Multimodal Disease Profiles
This is part one of a two-part post highlighting Napistu — a new framework for building genome-scale networks of molecular biology and biochemistry. In this post, I’ll tackle a fundamental challenge in computational biology: how to extract meaningful disease signatures from complex multimodal datasets.
Using methylmalonic acidemia (MMA) as my test case, I’ll demonstrate how to systematically extract disease signatures from multimodal data. My approach combines three complementary analytical strategies: exploratory data analysis to assess data structure and quality, differential expression analysis to identify disease-associated features, and factor analysis to uncover coordinated gene expression programs across data types. The end goal is to distill thousands of molecular measurements into a handful of interpretable disease signatures — each capturing a distinct aspect of disease biology that can be mapped to regulatory networks.
Throughout this post, I’ll use two types of asides to provide additional context without disrupting the main analytical flow. Green boxes contain biological details, while blue boxes reflect on the computational workflow and AI-assisted development process.
Flattening the Gompertz Distribution
In this post I’ll explore the Gompertz law of mortality which describes individuals’ accelerating risk of death with age.
The Gompertz equation describes per-year hazard (i.e., the likelihood of surviving from time $t$ to $t+1$) as the product of age-independent parameter $\alpha$ and an age-dependent component which increases exponentially with time scaled by another parameter $beta$ ($e^{\beta \cdot t}$).
The equation is thus:
\[\large h(t) = \alpha \cdot e^{\beta \cdot t}\]The Gompertz equation is often studied by taking its natural log resulting in a linear relationship between log(hazard) and increasing risk with age.
\[\large \ln(h(t)) = \ln(\alpha) + \beta \cdot t\]Formulating and estimating the parameters of demographic hazard models like the Gompertz’s equation is an active area of research, and there is a lot of information out there catering to both the academic and lay audiences. Still, when reviewing this literature, I did not see a clear summary of how decreases in $\beta$ (the chief aim of longevity research) would lead to lifespan extension.
False Discovery Rate (FDR) Overview and lFDR-Based Shrinkage
Coming from a quantitative genetics background, correcting for multiple comparisons meant controlling the family-wise error rate (FWER) using a procedure like Bonferroni correction. This all changed when I took John Storey’s “Advanced Statistics for Biology” class in grad school. John is an expert in statistical interpretation of high-dimensional data and literally wrote the book, well paper, on false-discovery rate (FDR) as an author of Storey & Tibshirani 2006. His description of the FDR has grounded my interpretation of hundreds of genomic datasets and I’ve continued to pay this knowledge forward with dozens of white-board style descriptions of the FDR for colleagues. As an interviewer and paper reviewer I still regularly see accomplished individuals and groups where “FDR control” is a clear blind spot. In this post I’ll layout how I whiteboard the FDR problem, and then highlight a specialized application of the FDR for “denoising” genomic datasets.

Time zero normalization with the Multivariate Gaussian distribution
Timecourses are a powerful experimental design for evaluating the impact of a perturbation. These perturbations are usually chemicals because chemicals, such as a drug, can be introduced quickly and with high temporal precision. Although, with some technologies, such as the estradiol-driven promoters that I used in the induction dynamics expression atlas (IDEA), it is possible to rapidly perturb a single gene further increasing specificity and broadening applicability. By rapidly perturbing individuals, they can be synchronized based on the time when dosing began. We often call this point when dosing begins “time zero” while all subsequent measurements correspond to the time post perturbation. (Since time zero corresponds to a point when a perturbation is applied, but will not yet impact the system, this measurement is usually taken before adding the perturbation.)
One of the benefits of collecting a time zero measurement is it allows us to remove, or account for, effects that are shared among all time points. In many cases this may just amount to analyzing fold-changes of post-perturbation measurement with respect to their time zero observation, rather than the original measurements themselves. This can be useful if there is considerable variation among timecourses irrespective of the perturbation, such as if we were studying humans or mice. Similarly, undesirable variation due to day-to-day variation in instruments, sample stability, or any of the many other factors which could produce batch effects, can sometimes by addressed by measuring each timecourse together and working with fold-changes. In either case, correcting for individual effects using pre-perturbation measurements will increase our power to detect perturbations’ effects.
Aside from correcting for unwanted variation, the kinetics of timecourses are a rich source of information which can be either a blessing or a curse. With temporal information, ephemeral responses can be observed. We can see both which features are changing and when they are changing. And, the ordering of events can point us towards causality. In practice, each of these goals can be difficult, or impossible to achieve, leaving us with a nagging feeling that we’re leaving information on the table. There are many competing options for identifying differences in timecourses, few ways of summarizing dynamics in an intuitive way, and causal inference is often out of reach. In this post, and others to follow, I’ll pick apart a few of these limitations, discussing developments that were applied to the IDEA, but will likely be useful for others thinking about biological timeseries analysis (or other timeseries if you are so inclined!). Here, I evaluate a few established methods for identifying features which vary across time and then introduce an alternative approach based on the Multivariate Gaussian distribution and Mahalanobis distance which increases power and does not require any assumptions about responses’ kinetics.

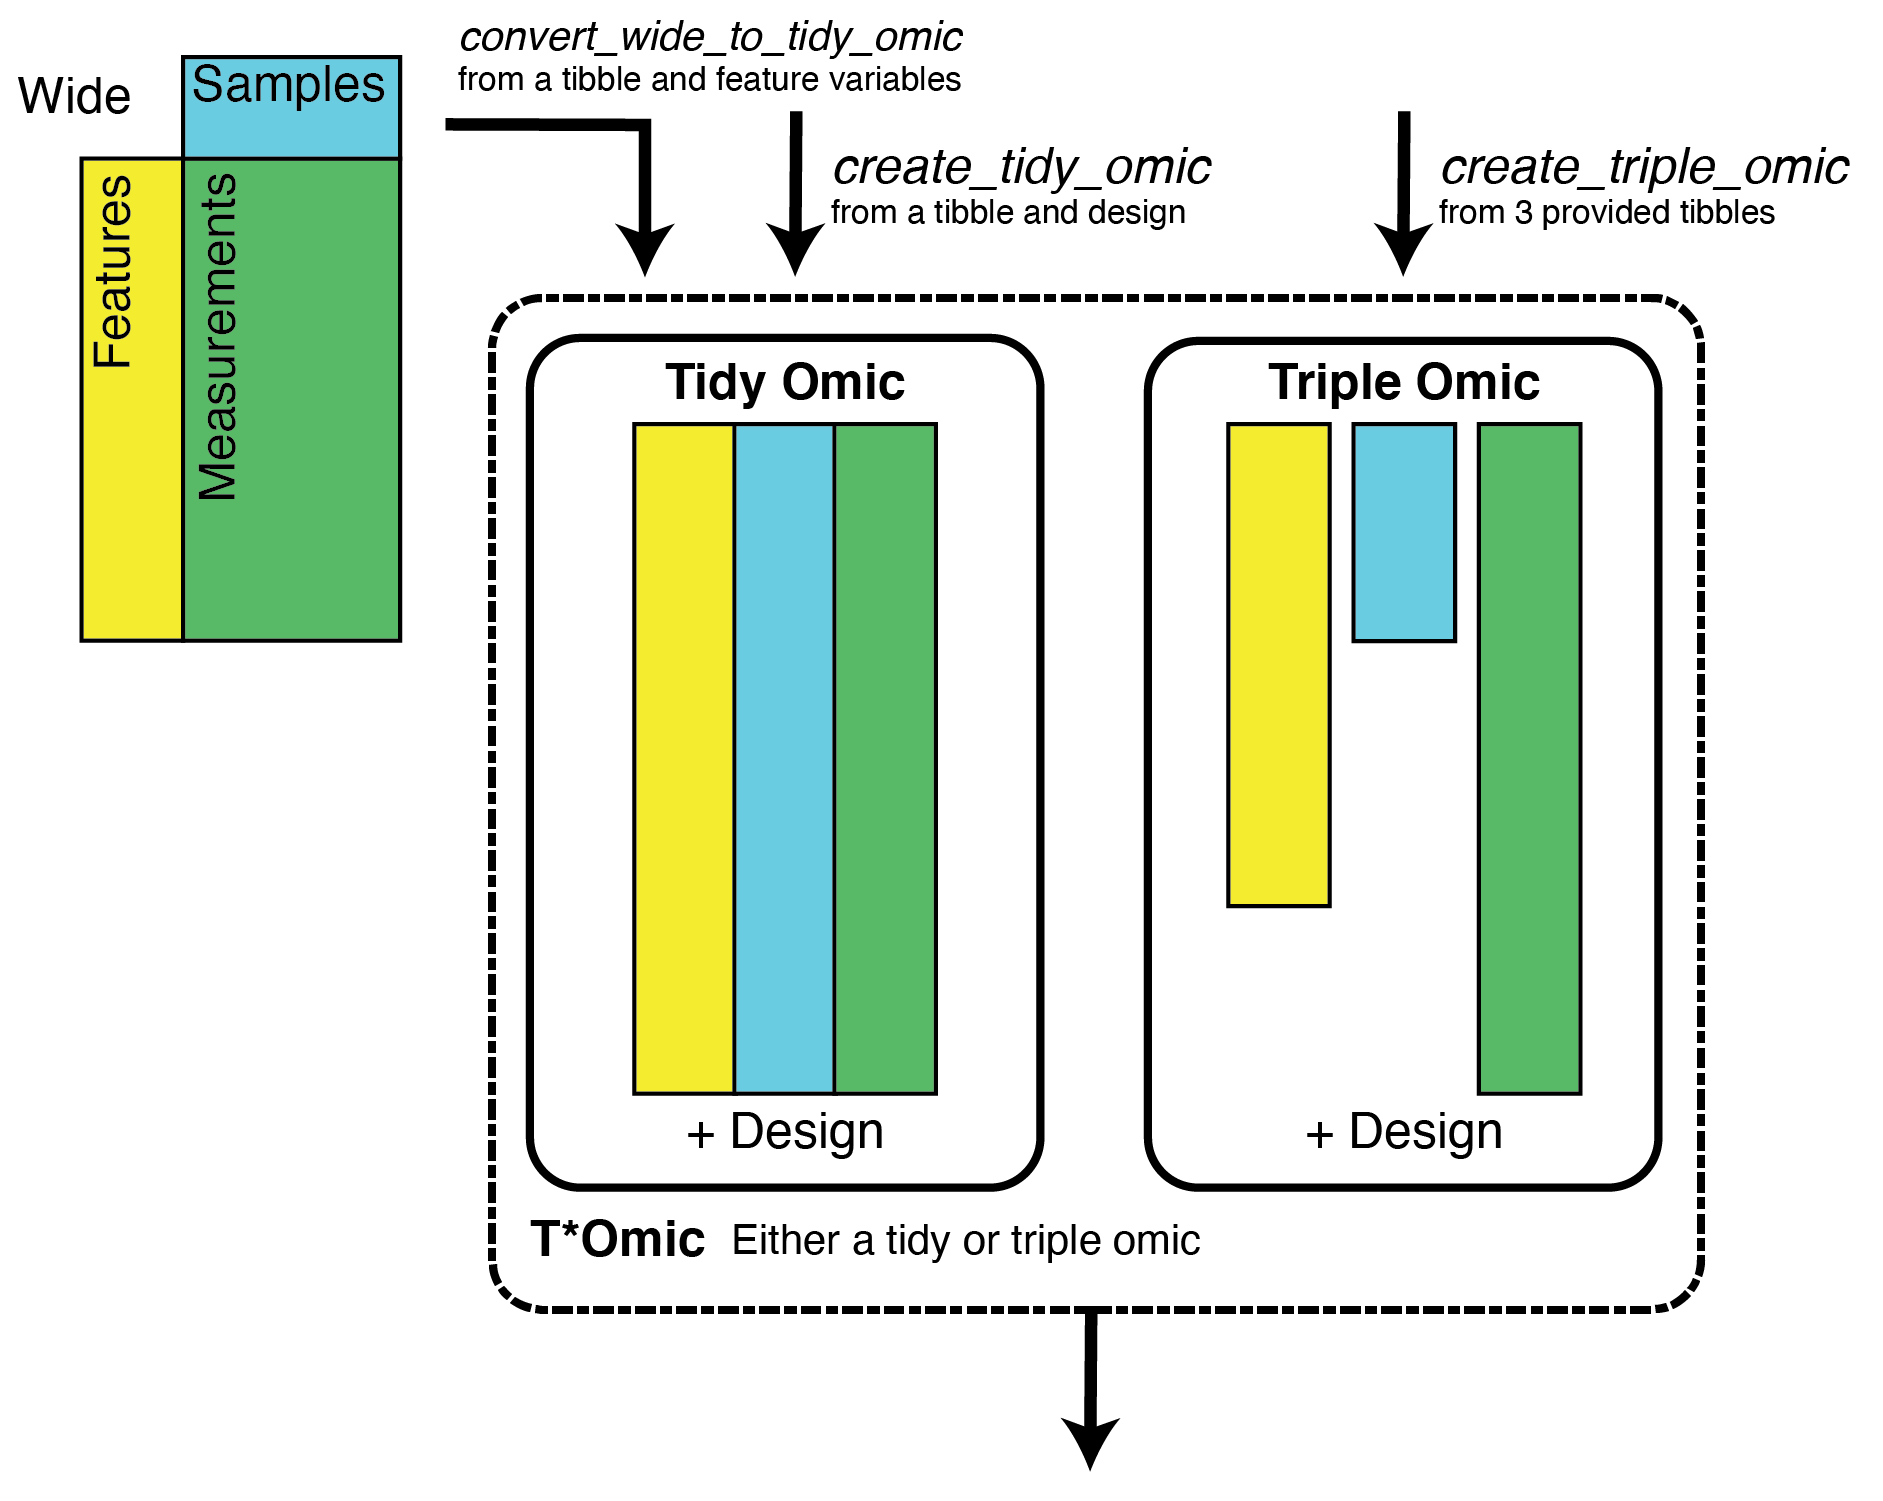
Romic: Data Structures and EDA for Genomics
Romic is an R package, which I developed, that is now is now available on CRAN. There is already a nice README for romic on GitHub and a pkgdown site, so here, I will add some context regarding the problems this package addresses.
The first problem we’ll consider is that genomics data analysis involves a lot of shuffling between various forms of wide and tall data and incrementally tacking on attributes as needed. Romic aims to simplify this process, by providing a set of flexible data structures that accommodate a range of measurements and metadata and can be readily inter-converted based on the needs of an analysis.
The second challenge we’ll contend with is decreasing the time it takes to generate a plot so that mechanics of plotting rarely interrupt the thought process of data interpretation. Building upon romic’s data structure, the meaning of variables (feature-, sample-, measurement-level) are encoded in a schema, so they can be appropriately surfaced to filter or reorder a dataset, and add ggplot2 aesthetics. Interactivity is facilitated using Shiny apps composed from romic-centric Shiny modules.
Both of these solutions increase the speed, clarity, and succinctness of analysis. I’ve developed and will continue to refine this package to save myself (and hopefully others!) time.